The stream tackles the topics relating to the possible causes of burnout through a podcast on the groups official youtube channel. Which happened last Sunday, April 16, 2023. During the duration of the livestream, the streamers were able to tackle the different possible causes of burnout.The streamers were also able to gather insight from their audience from the live chat which enabled them to have a wide understanding on the said topic.
By the end of the stream, the streamers received great remarks, constructive criticisms, and suggestions for how to improve on the streaming process in its entirety. One of the most mentioned suggestions was for the streamers to lessen the topics discussed and creativity to develop, plan, and execute another stream or episode, due to the fact that the majority of the viewers enjoyed the stream’s overall concept. One of the more critical criticisms was on the end of the streamers, due to the fact that majority of the streamers weren’t actively participating or engaging with the audience ‘vocally’. Overall despite the issues and minor mishaps, the stream can be said to have been a resounding success.,
The streamers were able to expand and tackle the topic of the possible causes of burnout, and were able to personally share their experiences regarding the topic being discussed.
The streamers successfully asked questions that are necessary to know more about the different possible causes of burnout and how to be able to cope with it, and what can be done to help other people who experience this. The streamers were also able to entertain the audience and answer the raised questions and interact with the audience which kept the stream more lively and active.
Based on the results of the Second livestream, the streamers concluded that the amount of engagements that they had was already at an excellent level for a Second time livestream. The streamers also concluded that the interactions they had with the audience of the livestream was more than enough to attract a positive response on the topic that was discussed in the livestream. The streamers noticed a lot of positive comments that were left by the audience regarding their livestream.
Blank Media’s viewers were most interested as to what causes burnout for other people as well as how it affects them personally. At the end of the stream, the streamers received many great remarks regarding our responses. Despite the fact that just a small portion of the viewers stayed and actively participated until the stream's conclusion, it was nevertheless an overall success. Overall, the viewers of the stream were actively engaged and genuinely interested about the discussion relating to the different causes of burnout.
All in all the team’s second live stream was a success. Despite moving to a new platform to stream, and whose advertising was mainly from word of mouth, their stream can be considered a success. With the group's youtube channel having a reach of 86 views, 16 peak viewers, 17.9 watch hours, with a total of 4 additional subscribers in the last 28 days since the second live stream and at the time of writing this paper, their stream is a success but it could have been better.
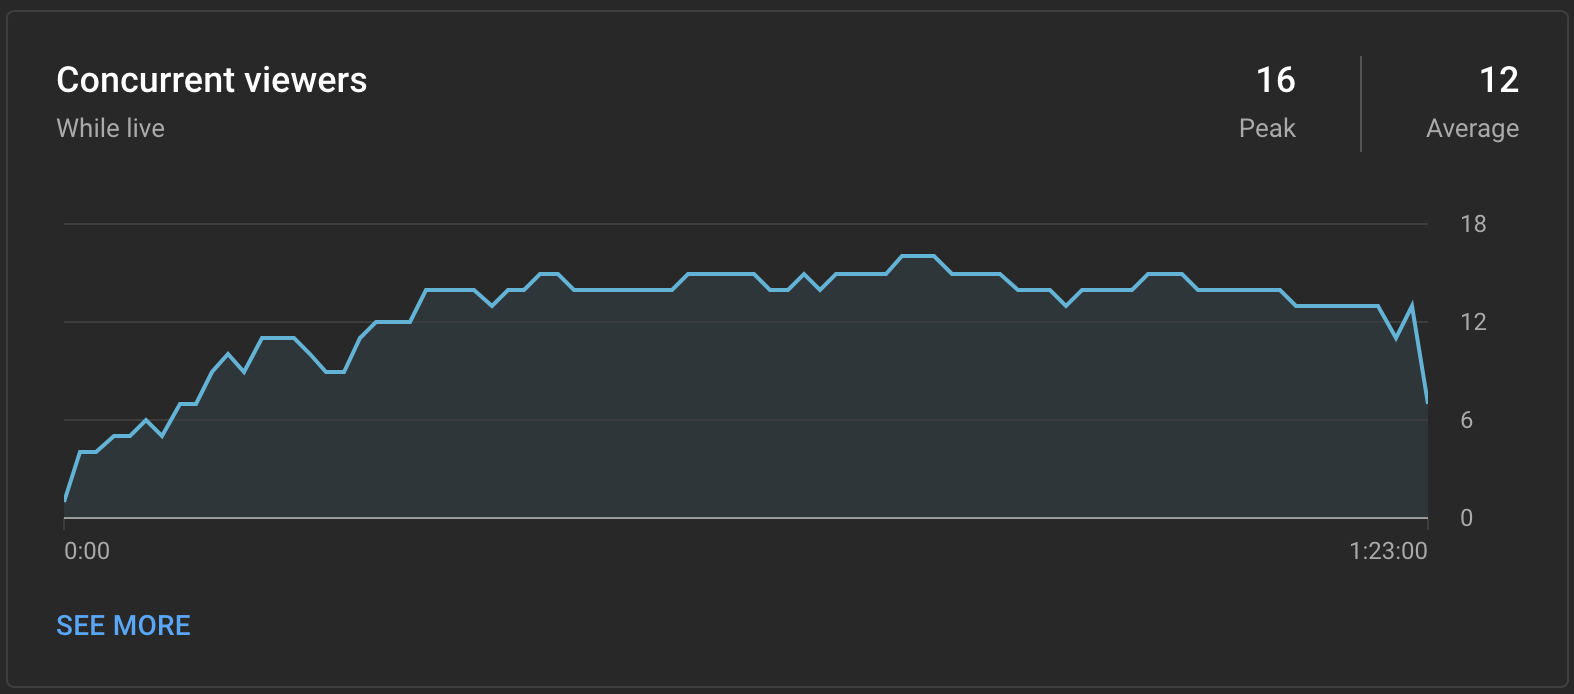
Figure 1. Concurrent Viewers
Based on the data provided, the Second livestream reached a peak of 16 viewers with an average of 12 viewers during the said livestream.
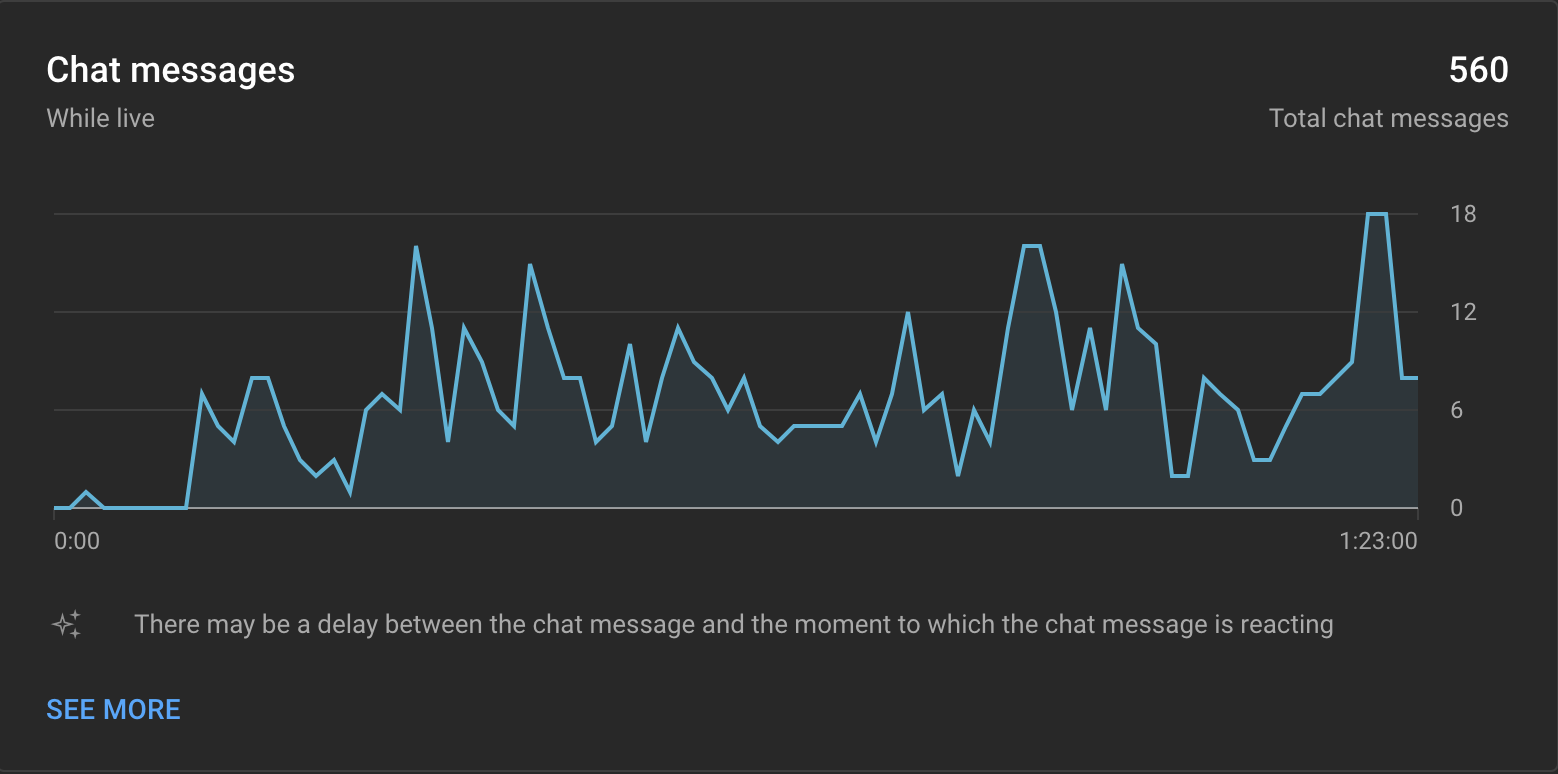
Figure 2. Chat Messages
From what we can see from the graph provided, the second livestream accumulated a total of 560 live chat message throughout the entire duration of the livestream.
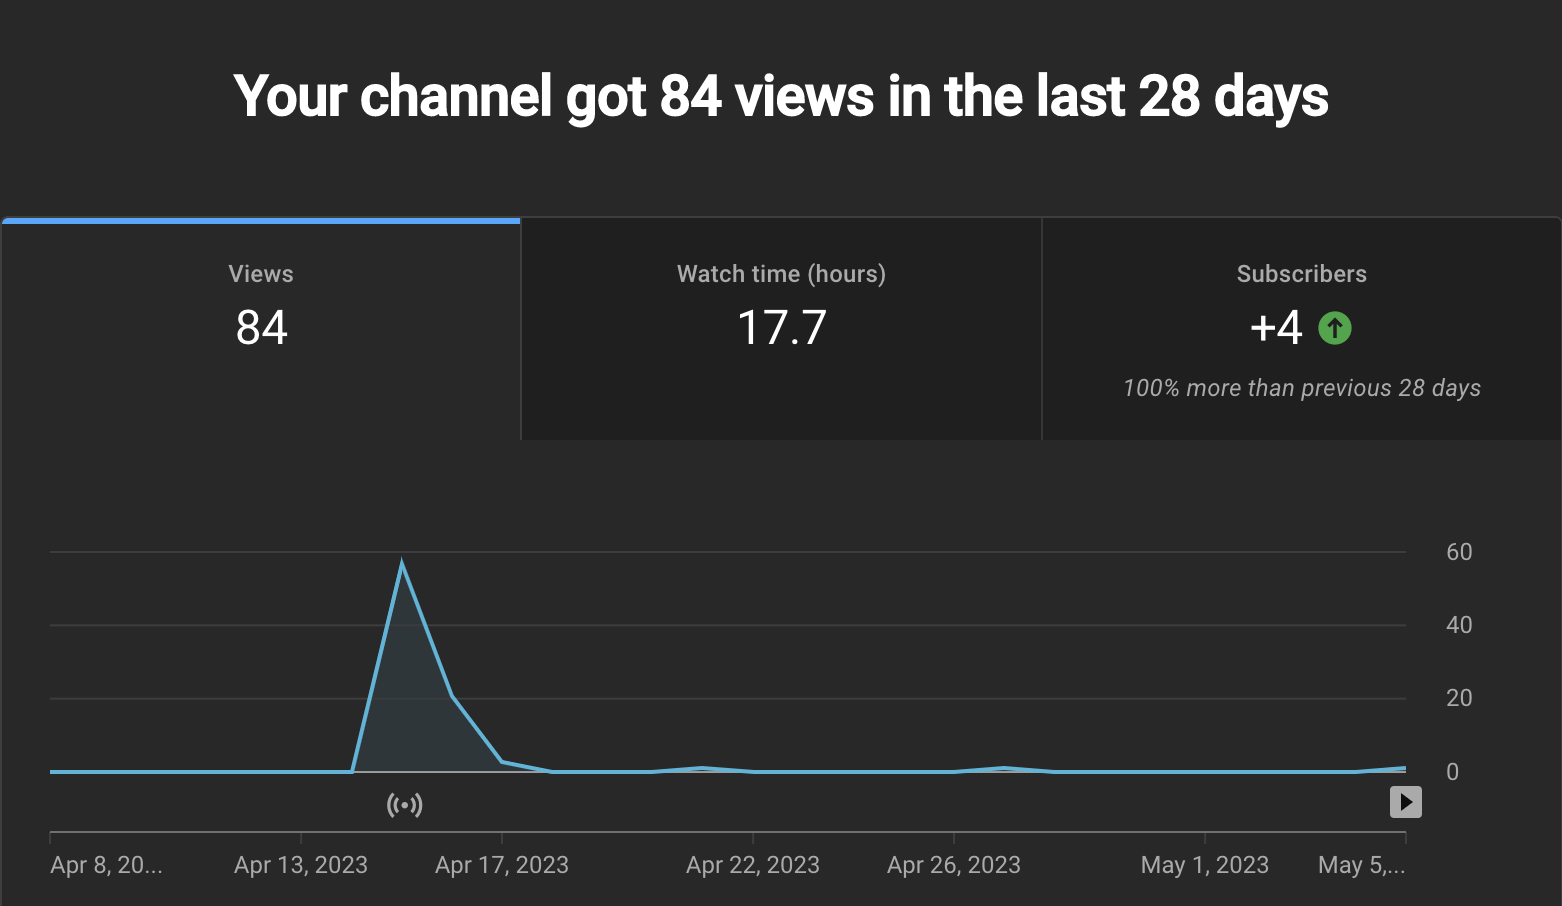
Figure 3. Channel Overview Analytics
From the data presented, The group's youtube channel got a total of 84 views in the last 28 days, with a combined watch time of 17.7 hours. And an additional 4 subscribers in the previous 28 days.
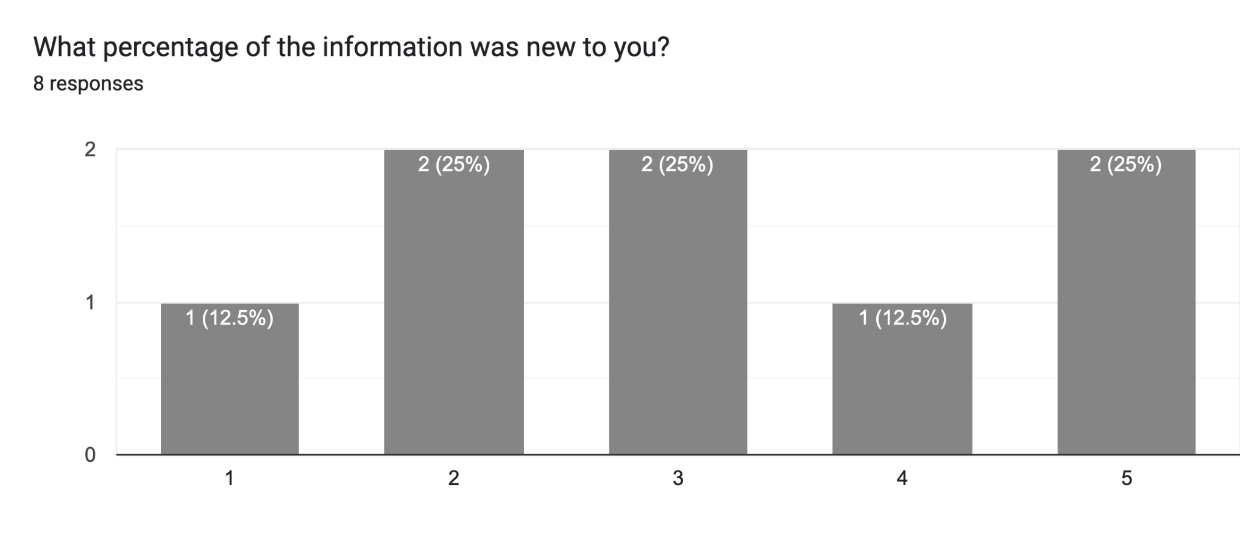
Figure 4. Total percentage of new information to the viewers
Based on the provided graph, a total of 75% of the respondents answered that at least 2,3, and 5% of the information shared to them through the livestream was new to them. While the remaining total of 25% of the respondents answered that at least 1 and 4% of the information shared through the live was new to them.
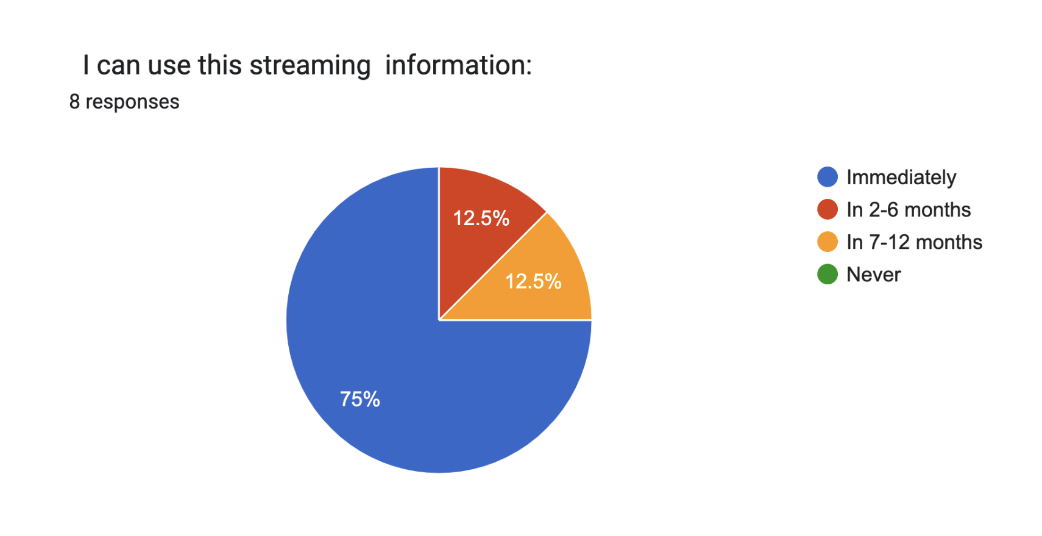
Figure 5. Usability of Information
According to the data gathered, 75% of the respondents stated that they would be able to use the information they have learned through the livestream immediately. While 12.5% of the respondents said that the information they have learned would be usable in the next 2-6 months. While another 12.5% said that the information they have learned would be usable in the next 7-12 months.
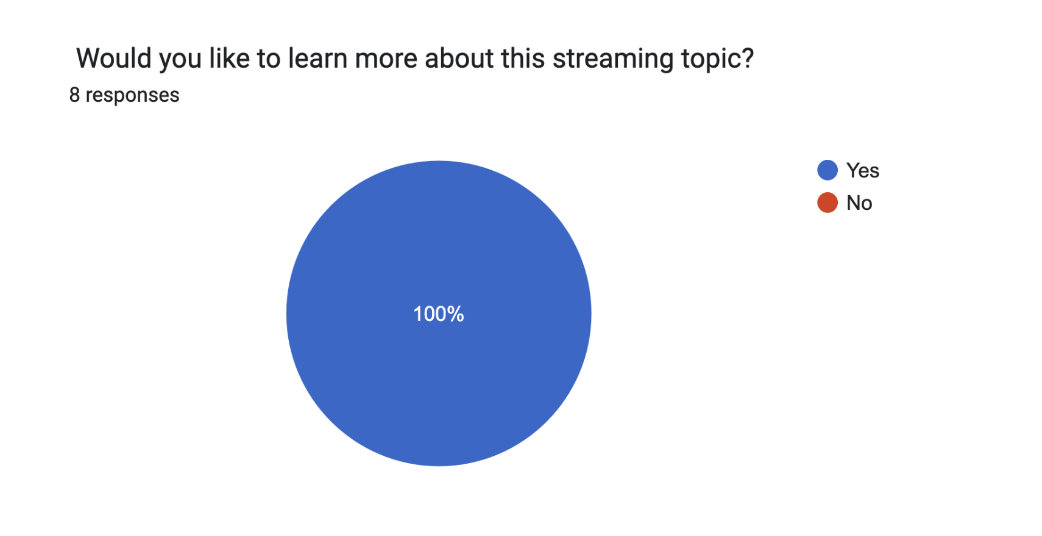
Figure 6.Would you like to learn more about the topic
Based on the data provided, 100% of the total respondents answered that they would like to learn more about the topic discussed during the livestream.
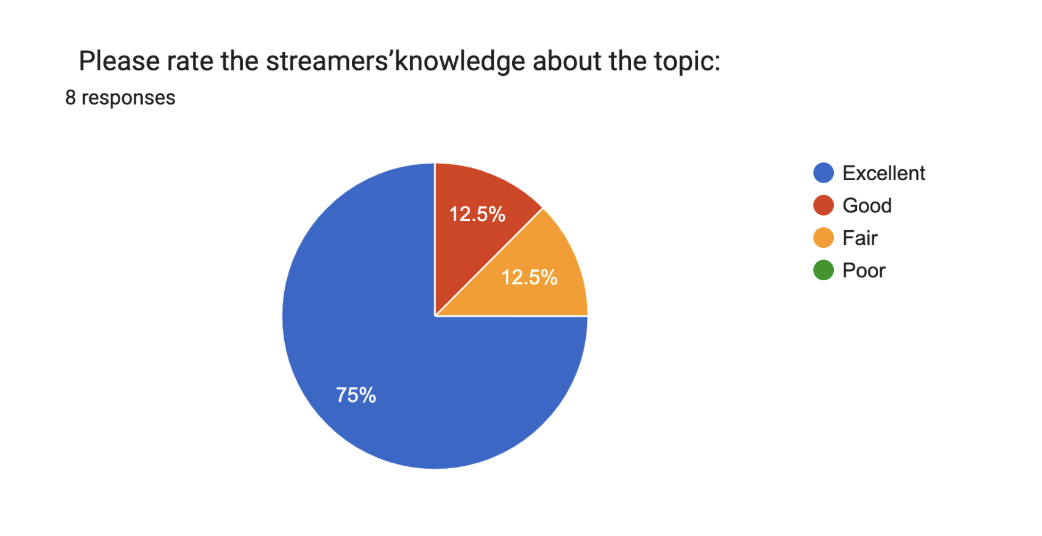
Figure 7. Streamers knowledge on the topic
According to the data gathered, 75% of the respondents stated that the streamers had excellent knowledge on the topic. While 12.5% of the respondents said that the streamers had good knowledge on the topic. And another 12.5% said that the streamers had fair knowledge on the topic.
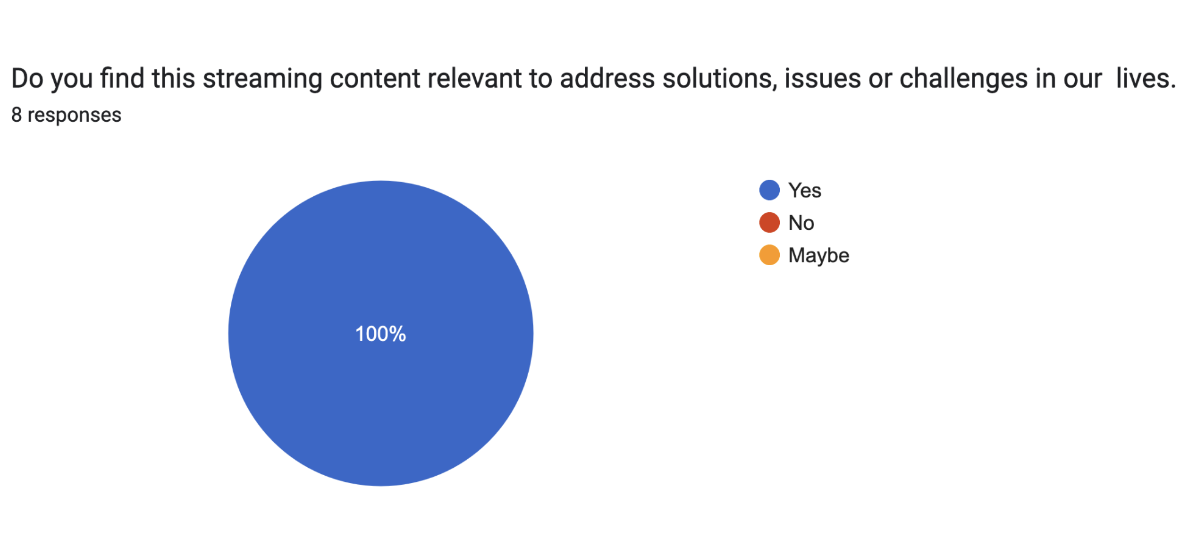
Figure 8. Content Relevance
As shown in the data presented, 100% of the total respondents said that they find the content’s topic to be relevant in their live.
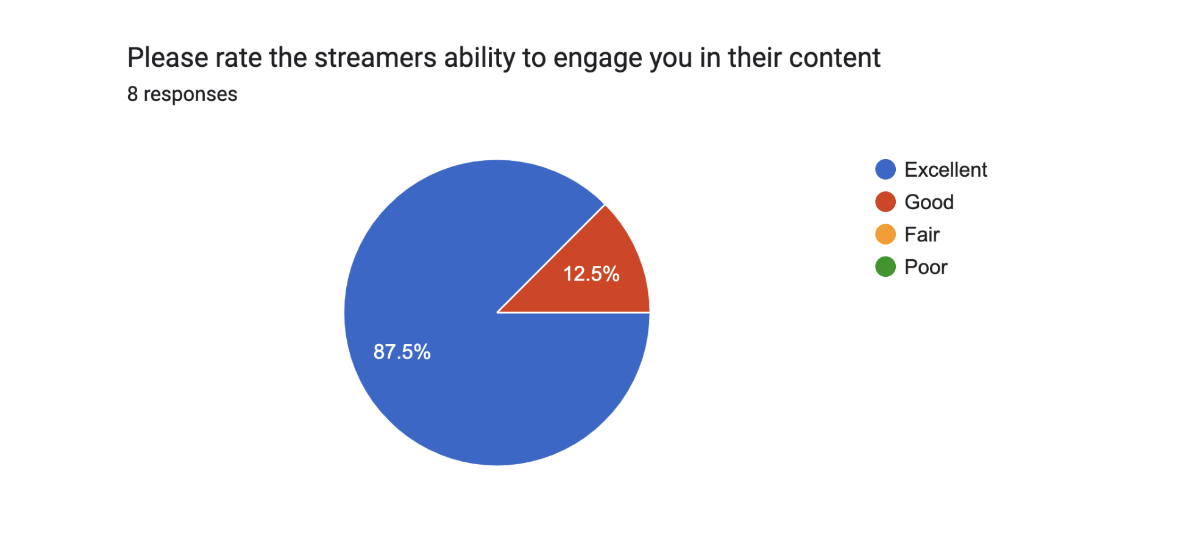
Figure 9. Streamers Ability to Engage
According to the data provided, 87.5% of the respondents answered that the streamers had an excellent ability when it comes to engaging them in their content. While the remaining 12.5% said that the streamers had good ability when it comes to engaging them.
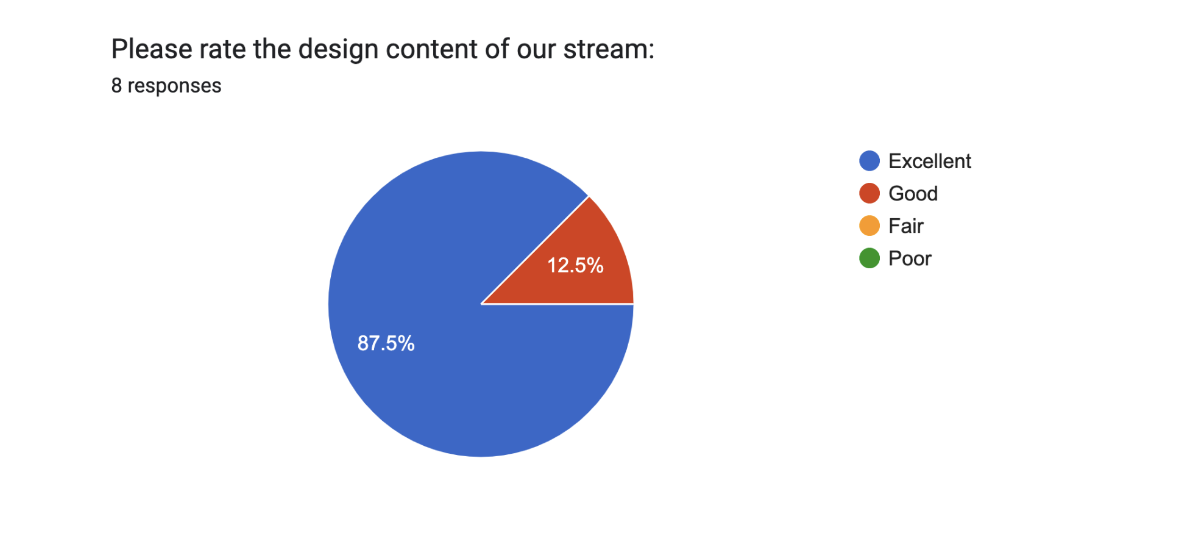
Figure 10. Design Content
According to the graph provided 85.7% of the respondents stated that the livestream had excellent design content, while the remaining 12.5% stated that the design content was good for them.
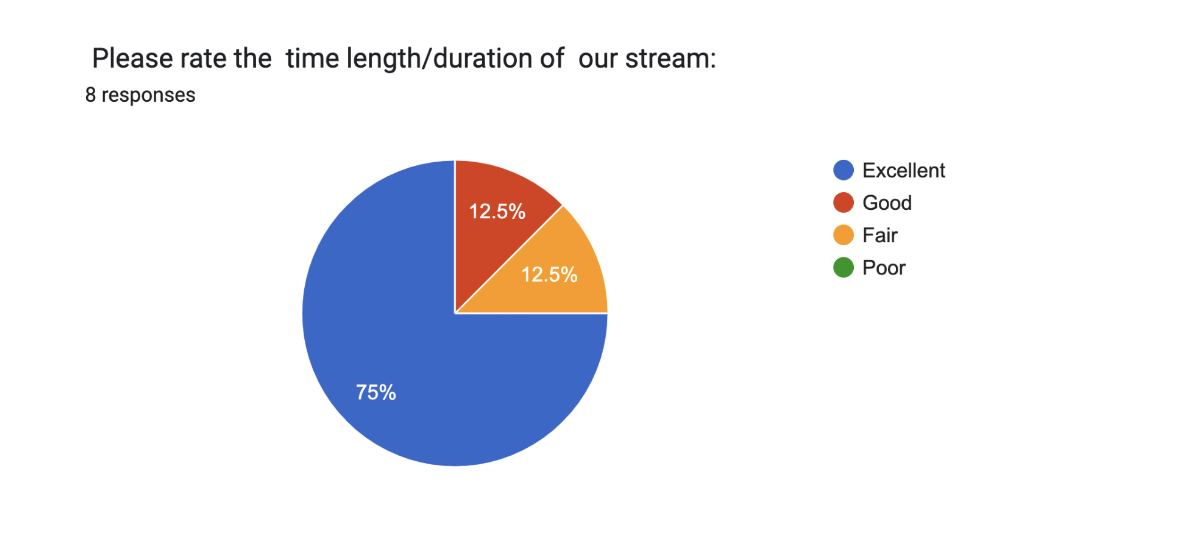
Figure 11. Time Length/Duration
Based on the graph, 75% of the respondents rated the time length/duration of the livestream to be excellent, while 12.5% of the respondents rated it good. And another 12.5% rated it to be fair.
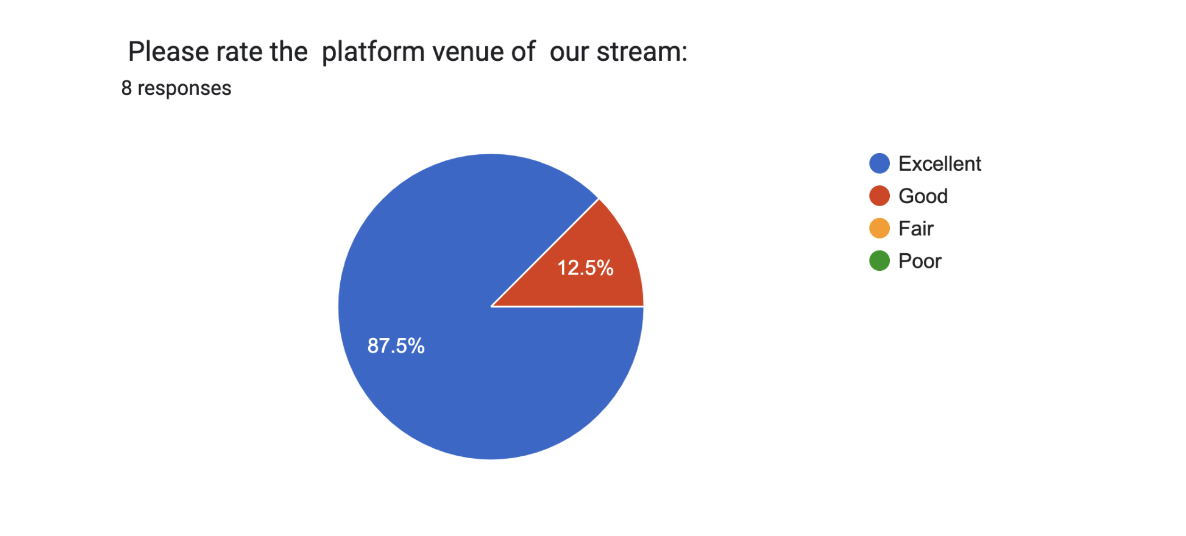
Figure 12. Platform Venue for Livestream
Based on the data provided we could conclude that 87.5% of the respondents stated that they find the platform venue of the livestream to be excellent. While 12.5% of respondents rated it to be good.
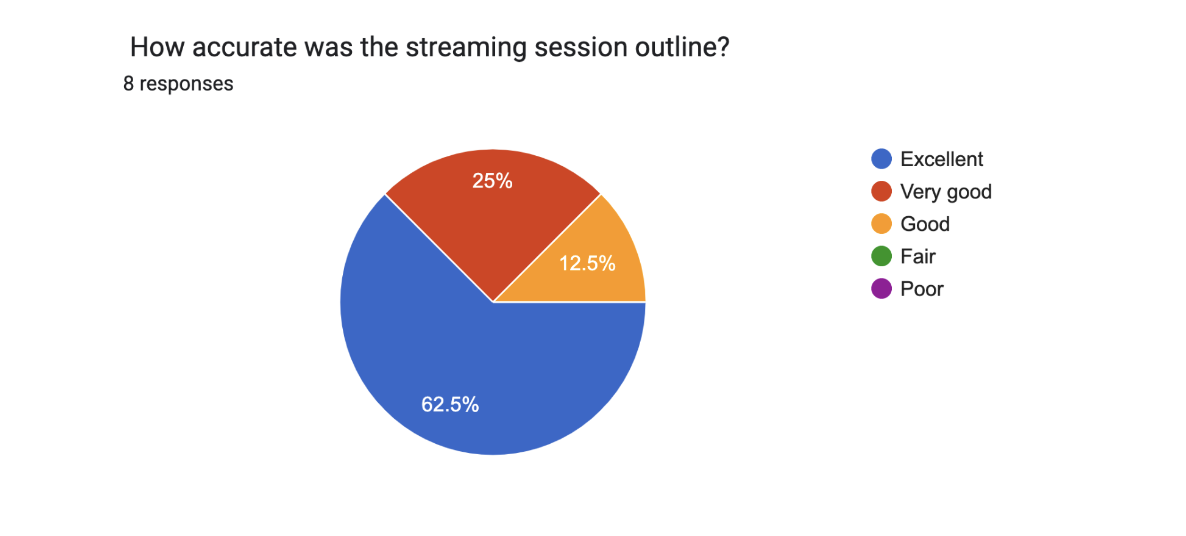
Figure 13. Accuracy of the Streaming Session Outline
With the provided graph, we can see that 62.5% of the respondents said that the accuracy of the streaming session outline was excellent. 25% of the respondents answered that the streaming session outline’s accuracy was good for them, while 12.5% of the respondents said that the accuracy of the streaming session outline for them was good.
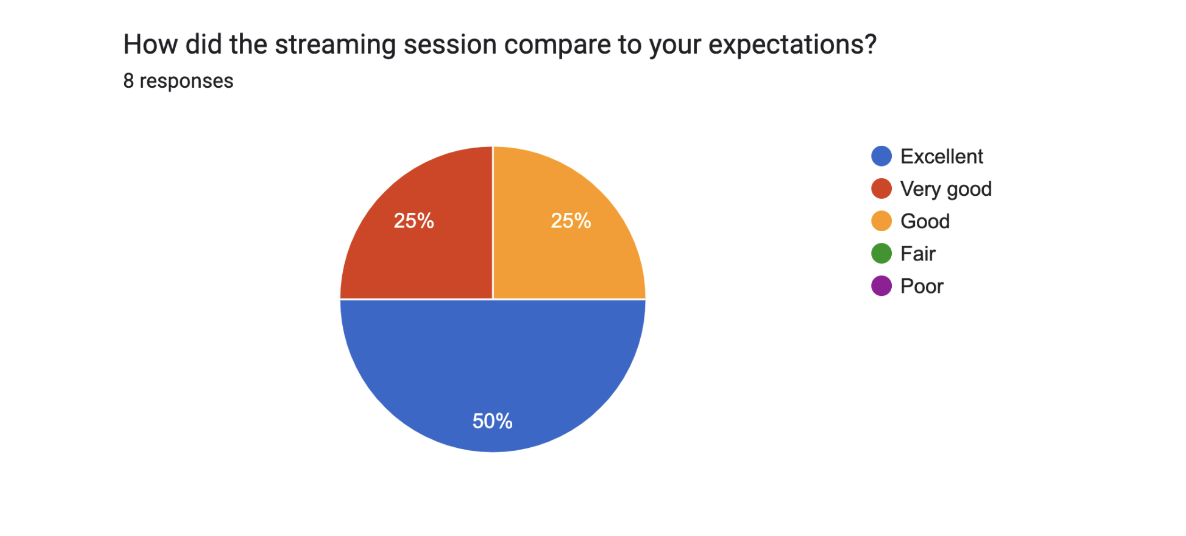
Figure 14. Streaming Session Expectations
With regards to the streaming session expectations, 50% of the respondents said that the session compared to their expectations excellently, while 25% said very good. And another 25% said good.
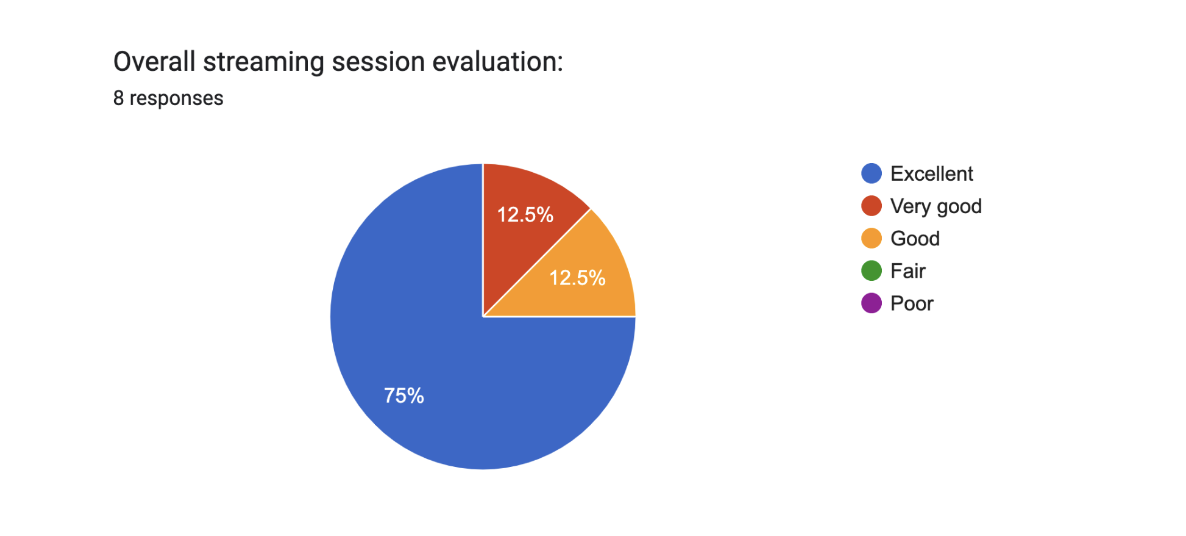
Figure 15. Overall Streaming Session Evaluation
According to 75% of the respondents, their overall streaming session evaluation was excellent, while 12.5% said that their overall streaming session evaluation was very good. And another 12.5% said that the overall session was good.
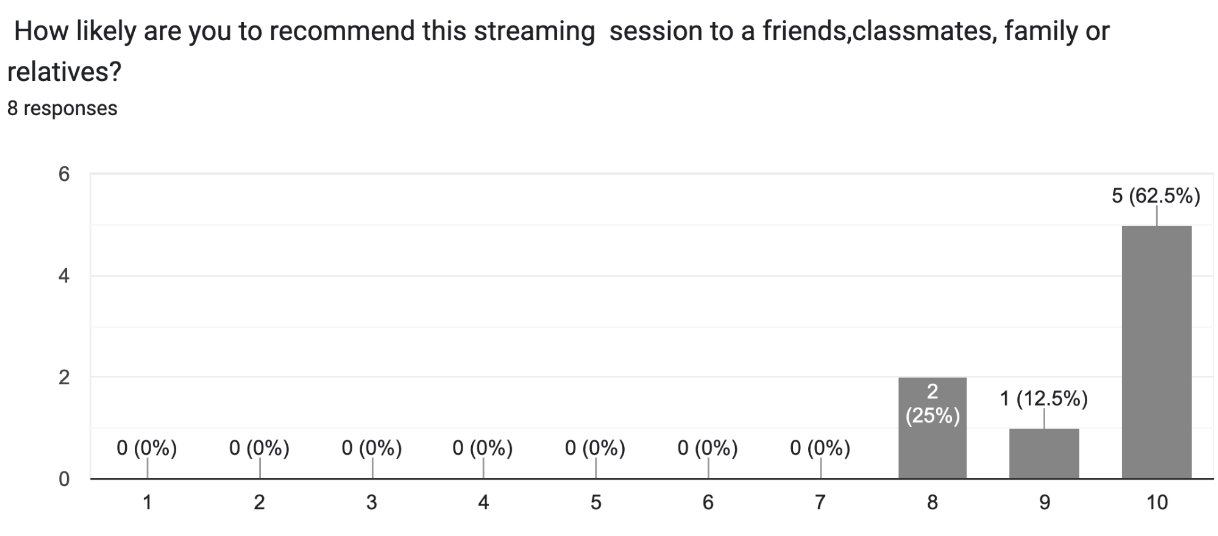
Figure 16. How likely are they to recommend the livestream to others
About 62.5% of the total respondents rated it 10 with regards to recommending the livestream to others, while 12.5% it a 9. And 25% rated it a 8.
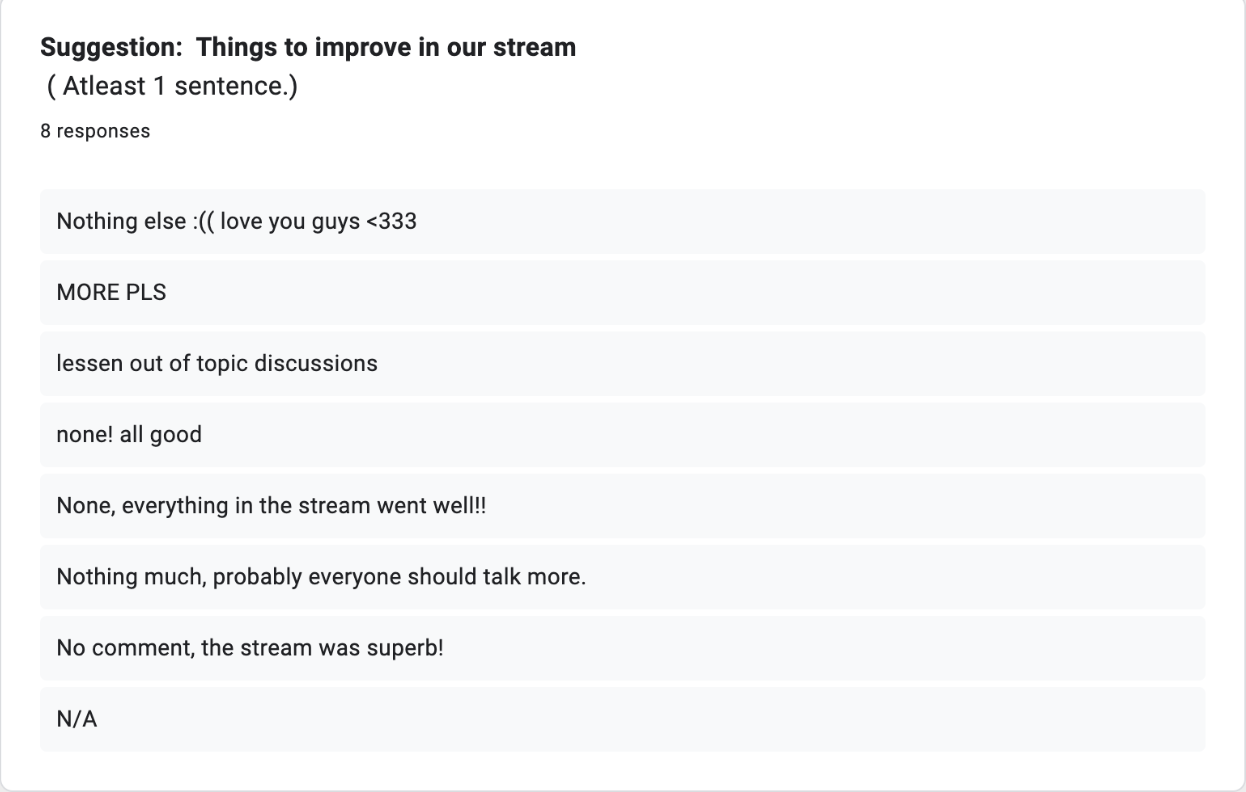
Figure 17. Suggestions
To summarize the suggestions received, we could see that the majority of the respondents said that they want nothing to be improved while the rest stated that the streamers should lessen the topics discussed and let everyone have the opportunity to talk more.